The CMJ force-time curve: what lies beyond jump height
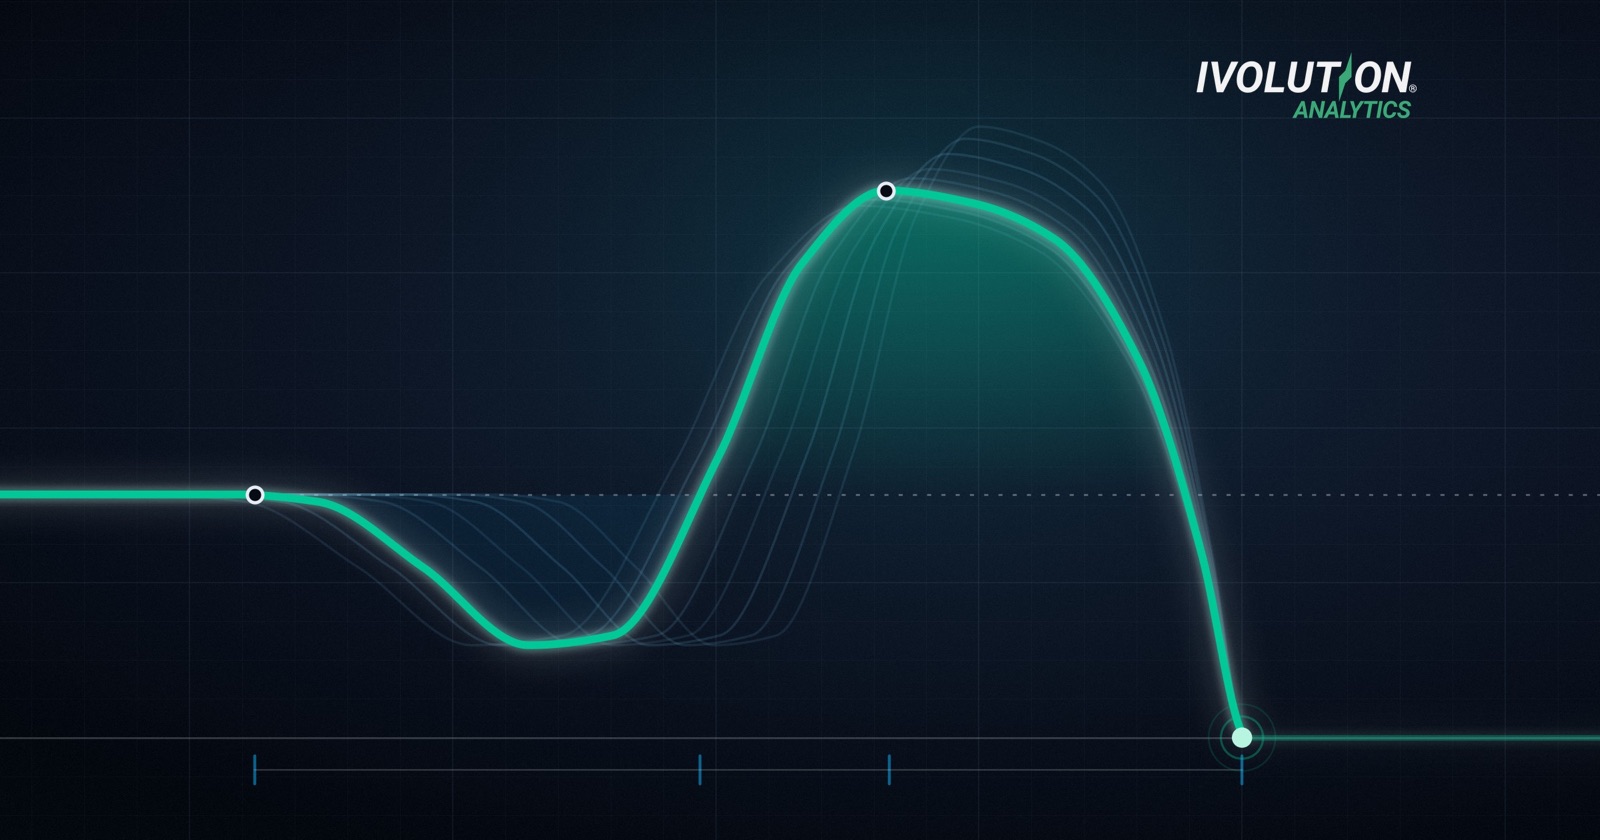
Jump height is the most reported variable of the countermovement jump (CMJ), and also the one that explains the least. Two athletes can jump exactly the same height with very different neuromuscular strategies, and the same athlete can maintain jump height while changing how it is produced, for example under fatigue. To see those differences, you need to look at the full force-time curve recorded by the force plate.
In this article we go through the phases of the curve, how jump height is calculated from it, and which strategy metrics are worth adding to the analysis. In Ivolution reports, the CMJ is presented under the Power quality.
What the force plate records
The force plate measures the vertical ground reaction force, usually at 1000 Hz or more. Everything else is derived from that single signal and the athlete's mass. According to Newton's second law, the acceleration of the center of mass is the net force (measured force minus body weight) divided by mass. Integrating acceleration gives velocity, and integrating velocity gives displacement.
This has a practical consequence: the body weight measured during quiet standing enters every calculation. An error of a few newtons in body weight accumulates during integration and shifts take-off velocity, and with it jump height (Street et al., 2001). That is why the protocol starts with at least one second of quiet standing on the plate.
The phases of the curve
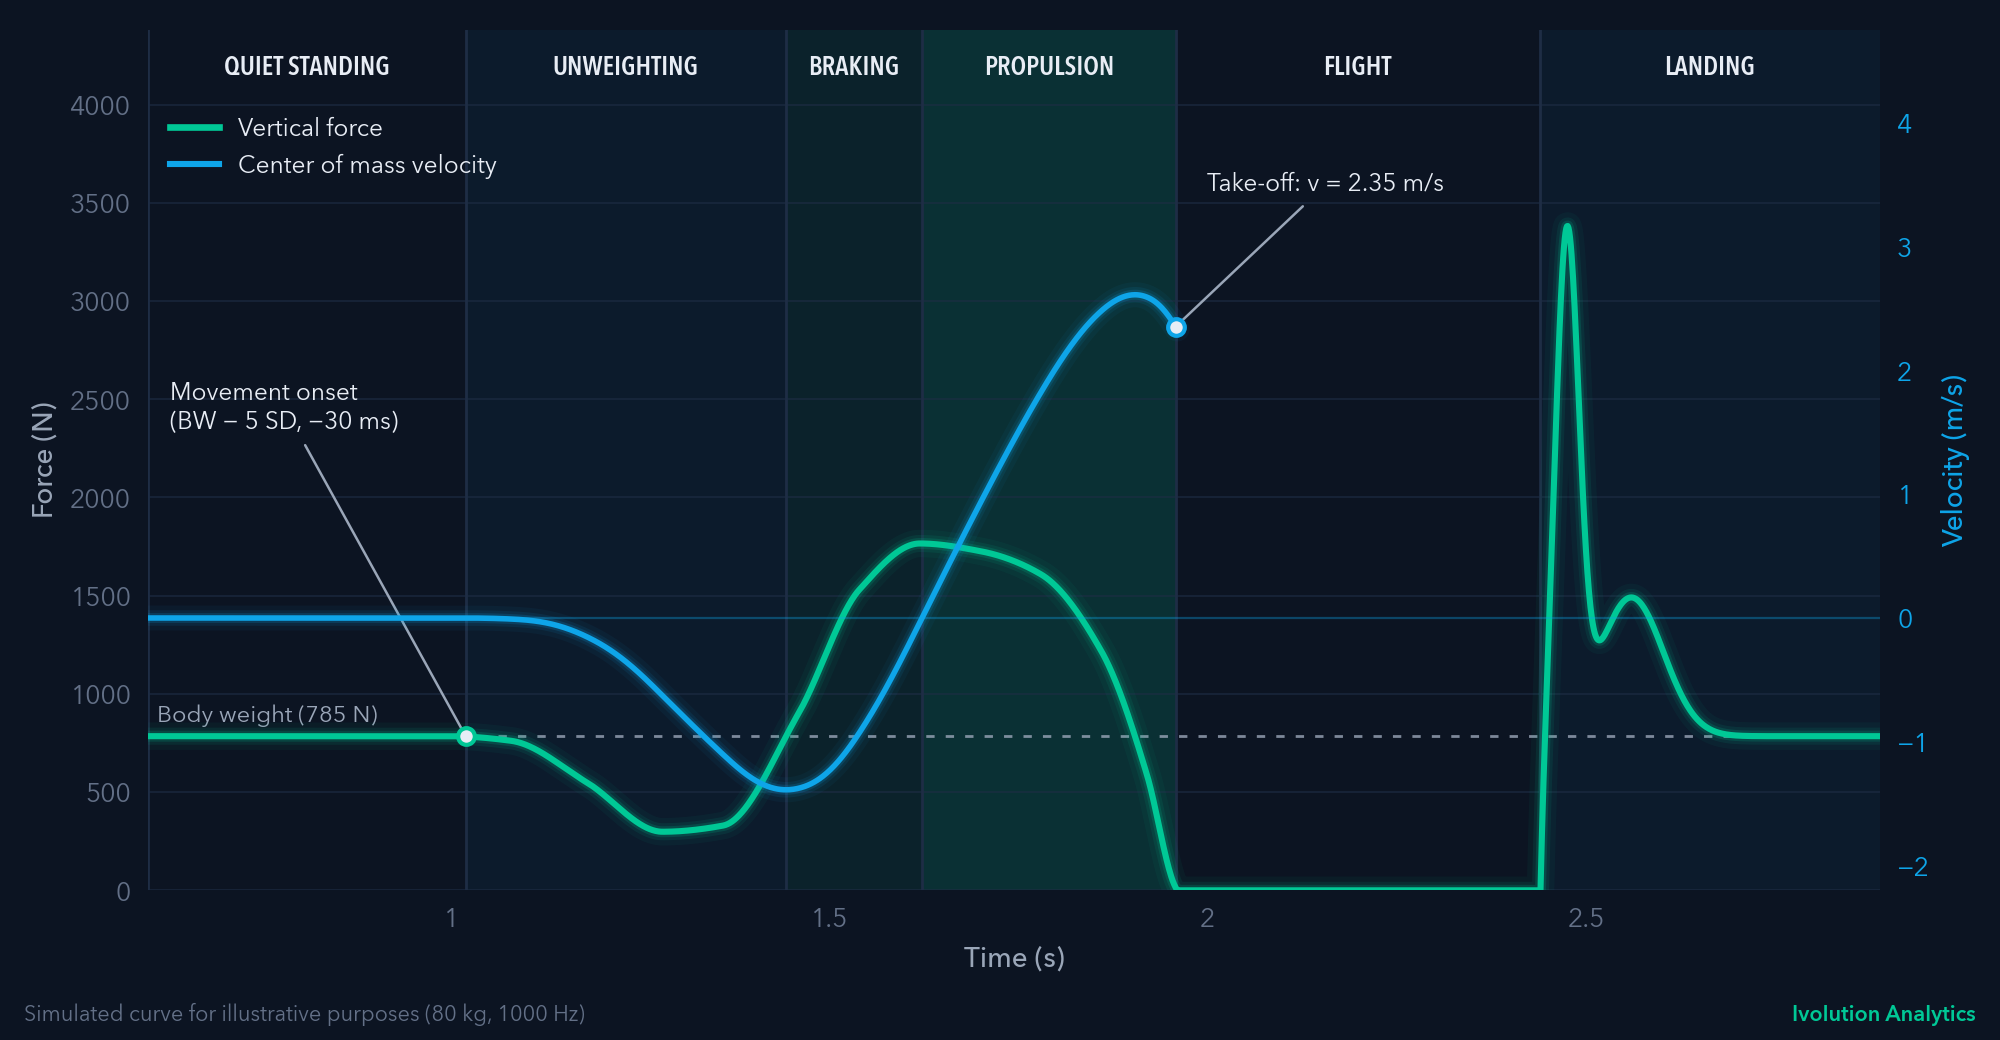
Vertical force (green) and center of mass velocity (blue) during a CMJ. Simulated curve for illustrative purposes.
The phase breakdown follows McMahon et al. (2018). Each phase is defined by an event in the signal, not by a fixed time.
Quiet standing
The athlete stands still. This section is used to calculate body weight (mean force) and its variability (standard deviation), which then defines the movement onset threshold.
Unweighting
It begins when force drops below body weight. A common criterion places the onset where force falls below body weight minus 5 standard deviations of quiet standing, and then steps back 30 ms from that point (Owen et al., 2014). During unweighting the center of mass accelerates downward. The phase ends when force returns to body weight, which coincides with peak negative velocity.
Braking
It runs from peak negative velocity until velocity reaches zero, that is, until the lowest point of the countermovement. Force exceeds body weight to decelerate the descent. Braking impulse, eccentric RFD and countermovement depth are measured in this phase.
Propulsion
It runs from zero velocity to take-off. The net impulse of this phase determines take-off velocity and, therefore, jump height. Take-off is detected when force falls below a low threshold, usually between 10 and 30 N.
Flight and landing
With the plate unloaded, force is zero. Landing produces an impact peak that plays no part in the impulse-based height calculation, although it provides information about the landing strategy.
Jump height: impulse-momentum or flight time
With a force plate there are two common ways to calculate jump height:
- Impulse-momentum. Net force is integrated to obtain take-off velocity (v), and height is calculated as h = v² / (2·g). It is the reference method because it describes what happens up to take-off (Linthorne, 2001; Moir, 2008).
- Flight time. Time without contact (t) is measured and height is calculated as h = g·t² / 8. It assumes the center of mass is at the same height at take-off and at landing. If the athlete lands with more hip, knee or ankle flexion than at take-off, flight time increases and jump height is overestimated.
The two methods are not interchangeable. If the method or the device changes (for example, from a contact mat to a force plate), it is better to re-establish the athlete's baseline than to compare against historical values.
Strategy metrics
Jump height summarizes the outcome. Strategy metrics describe how it was achieved:
- Time to take-off (s): from movement onset to take-off. It includes unweighting, braking and propulsion.
- RSImod (m/s): jump height divided by time to take-off (Ebben and Petushek, 2010). It relates how high the athlete jumps to how long the jump takes to produce.
- Countermovement depth (cm): minimum displacement of the center of mass. It shapes phase durations and the force needed to reverse the movement.
- Braking and propulsive impulse (N·s): area under the net force in each phase.
- Eccentric RFD (N/s): rate at which force rises during braking.
- Relative peak power (W/kg): maximum of the force × velocity product, divided by body mass.
Two athletes, the same height
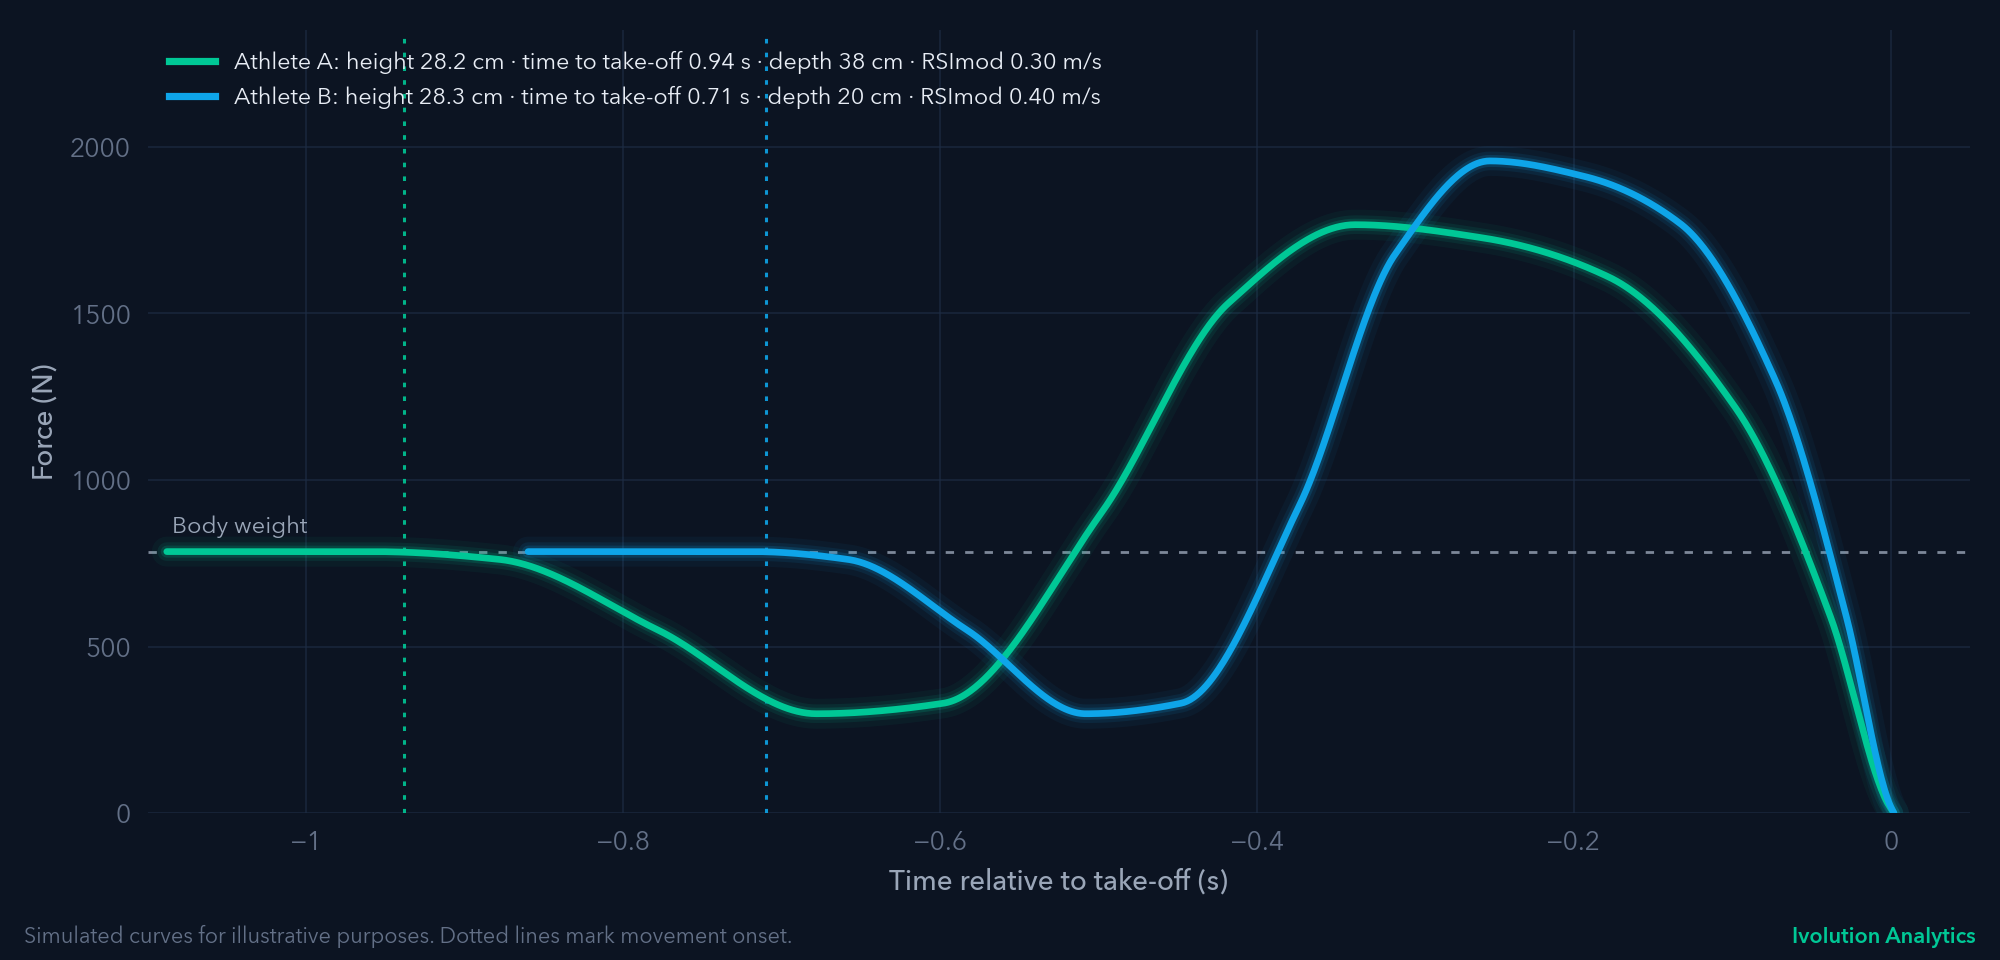
Force-time curves aligned at take-off. Simulated curves for illustrative purposes.
Both athletes in the figure jump 28 cm. Athlete A uses a deep countermovement (38 cm) and takes 0.94 s to leave the ground. Athlete B descends 20 cm and takes off in 0.71 s. With the same height, athlete B's RSImod is one third higher: 0.40 m/s versus 0.30 m/s.
Looking only at jump height, the two athletes are identical. Their strategies, however, raise different training questions: whether athlete A can produce the same force in less time, or whether athlete B can maintain the fast strategy under heavier loads.
Strategy changes with fatigue
The same reasoning applies within an athlete. Under neuromuscular fatigue, jump height is often maintained while time to take-off increases, because the athlete compensates with a longer or deeper countermovement. Variables that combine outcome and time, such as RSImod or the flight time to contraction time ratio, tend to detect these changes earlier than jump height alone (Gathercole et al., 2015).
Interpreting a change requires knowing the measurement error of each variable in your own setting. The useful comparison is against the athlete's baseline and usual variability, not against a fixed threshold applied to everyone.
What to report, and to whom
For the coaching staff
- Jump height calculated by impulse-momentum.
- RSImod.
- Trend of both relative to the athlete's baseline.
For the sports science team
- Duration of each phase and time to take-off.
- Countermovement depth.
- Braking and propulsive impulses.
- Eccentric RFD and relative peak power.
- Between-limb asymmetries, when using dual force plates.
Trial quality control
Before analyzing a jump, check for:
- At least 1 s of stable quiet standing before onset, without oscillations that affect body weight.
- No preliminary countermovement or bounce before the trial.
- A fixed arm position, always the same (for example, hands on hips).
- Landing on the plate, without exaggerated leg flexion during flight.
- Reasonable variability between trials in the same session.
A trial that does not meet these criteria should be flagged and excluded from the analysis, not deleted. The record of discarded trials also says something about the protocol.
Key takeaways
Jump height summarizes the outcome of the jump. The force-time curve explains how it was produced.
- Calculate jump height by impulse-momentum and keep the same method over time.
- Add at least one strategy metric, such as RSImod or time to take-off.
- Interpret each change against the athlete's baseline and measurement error.
References
- Ebben, W. P. and Petushek, E. J. (2010). Using the reactive strength index modified to evaluate plyometric performance. Journal of Strength and Conditioning Research, 24(8), 1983-1987. https://doi.org/10.1519/JSC.0b013e3181e72466
- Gathercole, R., Sporer, B., Stellingwerff, T. and Sleivert, G. (2015). Alternative countermovement-jump analysis to quantify acute neuromuscular fatigue. International Journal of Sports Physiology and Performance, 10(1), 84-92. https://doi.org/10.1123/ijspp.2013-0413
- Linthorne, N. P. (2001). Analysis of standing vertical jumps using a force platform. American Journal of Physics, 69(11), 1198-1204. https://doi.org/10.1119/1.1397460
- McMahon, J. J., Suchomel, T. J., Lake, J. P. and Comfort, P. (2018). Understanding the key phases of the countermovement jump force-time curve. Strength and Conditioning Journal, 40(4), 96-106. https://doi.org/10.1519/SSC.0000000000000375
- Moir, G. L. (2008). Three different methods of calculating vertical jump height from force platform data in men and women. Measurement in Physical Education and Exercise Science, 12(4), 207-218. https://doi.org/10.1080/10913670802349766
- Owen, N. J., Watkins, J., Kilduff, L. P., Bevan, H. R. and Bennett, M. A. (2014). Development of a criterion method to determine peak mechanical power output in a countermovement jump. Journal of Strength and Conditioning Research, 28(6), 1552-1558. https://doi.org/10.1519/JSC.0000000000000311
- Street, G., McMillan, S., Board, W., Rasmussen, M. and Heneghan, J. M. (2001). Sources of error in determining countermovement jump height with the impulse method. Journal of Applied Biomechanics, 17(1), 43-54. https://doi.org/10.1123/jab.17.1.43